
☁️ AWS CloudWatch Deep Dive | Monitor EC2, Logs, Metrics & CPU Alerts with SNS 🚨
Beginner-friendly notes on AWS CloudWatch with practical EC2 CPU monitoring and email alerts using Amazon SNS.

📌 Table of Contents
What is AWS CloudWatch?
Why Do We Need CloudWatch?
Main Components of CloudWatch
CloudWatch Metrics
CloudWatch Logs and Log Groups
CloudWatch Alarms
What is Amazon SNS?
CloudWatch + SNS Architecture
Practical Project: EC2 CPU Alert
Step-by-Step Implementation
Testing the Alarm
Important CloudWatch Concepts
Default vs Custom Metrics
Common Use Cases
Best Practices
Interview Questions and Answers
Key Takeaways

1️⃣ What is AWS CloudWatch?
Amazon CloudWatch is a monitoring and observability service provided by AWS.
It helps us monitor:
🖥️ EC2 instances
📊 CPU utilization
💾 Memory and disk usage
📜 Application logs
🔄 AWS services
🚨 Infrastructure problems
📩 Alerts and notifications
In simple words:
CloudWatch helps us understand what is happening inside our AWS infrastructure.
For example, imagine you have an EC2 server running your application.
You may want to know:
Is the server running?
Is CPU usage too high?
Is the application generating errors?
Is disk space running out?
Has the server stopped responding?
CloudWatch helps you monitor these things.
2️⃣ Why Do We Need CloudWatch?
Without monitoring, we may only discover a problem after users complain.
For example:
Application becomes slow
        ↓
Users face problems
        ↓
Users complain
        ↓
Team starts investigating
This is called reactive monitoring.
With CloudWatch:
Application
     ↓
CloudWatch monitors metrics
     ↓
Threshold is crossed
     ↓
CloudWatch Alarm
     ↓
SNS Notification
     ↓
DevOps Team receives alert
This allows the team to identify problems quickly.
3️⃣ Main Components of AWS CloudWatch
The major components are:
| Component | Purpose |
|---|---|
| 📊 Metrics | Numerical performance data |
| 📜 Logs | Application and system logs |
| 🚨 Alarms | Trigger actions when thresholds are crossed |
| 📈 Dashboards | Visual monitoring of resources |
| 🔔 Events / Rules | Respond to changes and events |
The most important concepts for beginners are:
Metrics → Monitoring Data

Logs → Application/System Records

Alarms → Alert when something goes wrong

SNS → Send notifications

4️⃣ What Are CloudWatch Metrics? 📊
A metric is a numerical measurement that represents the performance or behavior of a resource.
For example:
CPU Utilization = 75%

Network In = 100 MB

Disk Usage = 80%

Number of Requests = 5,000
AWS automatically provides many default metrics for its services.
For an EC2 instance, some common metrics are:
CPUUtilization
NetworkIn
NetworkOut
DiskReadOps
DiskWriteOps
StatusCheckFailed
Example:
CPU Utilization

10:00 → 20%
10:05 → 35%
10:10 → 70%
10:15 → 90%
If CPU reaches a dangerous level, CloudWatch can trigger an alarm.
5️⃣ CloudWatch Logs 📜
Logs contain information about events happening inside applications and systems.
For example:
Application started

User login successful

Database connection failed

API request received

Application error occurred
CloudWatch Logs allows us to collect and store these logs in AWS.
A common structure is:
CloudWatch Logs
      │
      └── Log Group
              │
              ├── Log Stream
              ├── Log Stream
              └── Log Stream
What is a Log Group?
A Log Group is a collection of related logs.
Example:
/aws/codebuild/my-project
This log group may contain logs generated by a CodeBuild project.
Another example:
/application/backend
Inside the Log Group, multiple Log Streams can exist.
6️⃣ What Are CloudWatch Alarms? 🚨
A CloudWatch Alarm watches a metric and performs an action when a condition is met.
For example:
IF CPU Utilization > 80%
FOR 5 minutes

THEN

Send Email Alert
The flow looks like:
EC2 Instance
     ↓
CPU Metric
     ↓
CloudWatch
     ↓
CloudWatch Alarm
     ↓
Amazon SNS
     ↓
📧 Email Notification

7️⃣ What is Amazon SNS? 🔔
Amazon Simple Notification Service (SNS) is a messaging and notification service.
SNS can send notifications through:
📧 Email
📱 SMS
🔗 HTTP/HTTPS endpoints
📲 Mobile notifications
AWS Lambda
Other AWS services
In this project, SNS will send an email notification when CPU usage crosses the configured threshold.
8️⃣ CloudWatch + SNS Architecture
The architecture for this project is simple:
                ┌─────────────────┐
                │   EC2 Instance  │
                │                 │
                │  CPU Usage      │
                └────────┬────────┘
                         │
                         ▼
                ┌─────────────────┐
                │   CloudWatch    │
                │                 │
                │    Metrics      │
                └────────┬────────┘
                         │
              CPU > Threshold
                         │
                         ▼
                ┌─────────────────┐
                │ CloudWatch Alarm│
                └────────┬────────┘
                         │
                         ▼
                ┌─────────────────┐
                │    Amazon SNS   │
                └────────┬────────┘
                         │
                         ▼
                   📧 Email Alert

9️⃣ Practical Project 🚀
Project: Monitor EC2 CPU Utilization and Send Email Alerts
In this project, we will:
Launch an EC2 instance.
Monitor its CPU utilization.
Create an SNS Topic.
Subscribe an email address.
Create a CloudWatch Alarm.
Set a CPU threshold.
Generate CPU load.
Trigger the alarm.
Receive an email notification.
🔟 Prerequisites
Before starting, you need:
An AWS Account
Basic knowledge of EC2
An EC2 instance
Permission to access CloudWatch and SNS
An active email address
Step 1️⃣ Launch an EC2 Instance 🖥️
Go to:
AWS Console
→ EC2
→ Launch Instance
For learning purposes, you can select:
AMI: Ubuntu

Instance Type:
t2.micro / t3.micro
Configure the required settings and launch the instance.
After launching:
EC2 Dashboard
        ↓
Instances
        ↓
Select your instance
Make sure the instance state is:
Running
Step 2️⃣ Check EC2 Metrics in CloudWatch 📊
Go to:
AWS Console
→ CloudWatch
→ Metrics
Then navigate to:
AWS Namespaces
→ EC2
→ Per-Instance Metrics
Select your EC2 instance.
You should see metrics such as:
CPUUtilization

NetworkIn

NetworkOut

DiskReadOps

DiskWriteOps
Select:
CPUUtilization
You will now see a graph showing the CPU usage of your EC2 instance.
Step 3️⃣ Create an SNS Topic 🔔
Go to:
AWS Console
→ Amazon SNS
→ Topics
→ Create Topic
Choose:
Type: Standard
Example:
Name:

EC2-CPU-Alert
Then click:
Create Topic
Step 4️⃣ Create an SNS Subscription 📧
After creating the topic:
SNS Topic
→ Create Subscription
Select:
Protocol:

Email
Enter your email address.
For example:
your-email@example.com
Click:
Create Subscription
AWS will send a confirmation email.
Open the email and click:
Confirm Subscription
Your subscription should now show:
Status: Confirmed
⚠️ Important: If you do not confirm the subscription, SNS will not send notifications to your email.
Step 5️⃣ Create a CloudWatch Alarm 🚨
Go to:
CloudWatch
→ Alarms
→ Create Alarm
Click:
Select Metric
Navigate to:
EC2
→ Per-Instance Metrics
→ CPUUtilization
Select your EC2 instance.
Step 6️⃣ Configure the Alarm Condition
For example:
Threshold Type:

Static
Set the condition:
CPUUtilization > 70%
You can configure:
Whenever CPUUtilization is...

Greater than 70
Example:
CPU Usage: 20%  → OK

CPU Usage: 50%  → OK

CPU Usage: 75%  → ALARM 🚨
Step 7️⃣ Configure the Alarm Action
When the alarm enters the ALARM state, select:
Send notification to:

EC2-CPU-Alert
This connects:
CloudWatch Alarm
        ↓
SNS Topic
        ↓
Email
Step 8️⃣ Name the Alarm
Example:
Alarm Name:

High-EC2-CPU-Utilization
You can also add a description:
This alarm monitors EC2 CPU utilization and sends an SNS notification when CPU usage exceeds 70%.
Click:
Create Alarm
Initially, the alarm state may show:
Insufficient Data
After CloudWatch receives enough metric data, it will change to:
OK

1️⃣1️⃣ How to Test the CloudWatch Alarm 🧪
Now we need to increase the CPU usage of the EC2 instance.
First, connect to your EC2 instance:
ssh -i key.pem ubuntu@<EC2-PUBLIC-IP>
Install a CPU stress tool:
sudo apt update
sudo apt install stress -y
Generate CPU load:
stress --cpu 2 --timeout 300
This command will:
Generate CPU Load
        ↓
Increase CPU Utilization
        ↓
CloudWatch detects metric change
        ↓
Threshold crossed
        ↓
Alarm changes to ALARM
        ↓
SNS sends Email 🚨
After the configured evaluation period, you should receive an email notification.
Example:
Subject:

ALARM: High-EC2-CPU-Utilization
Congratulations! 🎉
You have successfully created an automated AWS monitoring and alerting system.
1️⃣2️⃣ Understanding CloudWatch Alarm States
CloudWatch alarms generally have three states.
🟢 OK
Everything is working normally.
Example:
CPU = 25%
🔴 ALARM
The configured threshold has been crossed.
Example:
CPU > 70%
The configured action is triggered.
🟡 INSUFFICIENT_DATA
CloudWatch does not have enough data to determine the alarm state.
This may happen when:
The instance was recently launched.
Metrics are not available yet.
The monitoring configuration changed.
1️⃣3️⃣ Default Metrics vs Custom Metrics
Default Metrics
AWS automatically provides metrics for many AWS services.
Examples:
EC2 CPU Utilization

Network In

Network Out
You do not need to manually configure these basic metrics.
Custom Metrics
Sometimes AWS does not provide the exact metric you need.
For example:
Application Response Time

Custom Business Metrics

Number of Active Users

Memory Usage

Disk Usage
In such cases, you can send custom data to CloudWatch.
Example architecture:
Application
      ↓
CloudWatch Agent
      ↓
CloudWatch Custom Metric
      ↓
CloudWatch Alarm
      ↓
SNS Notification
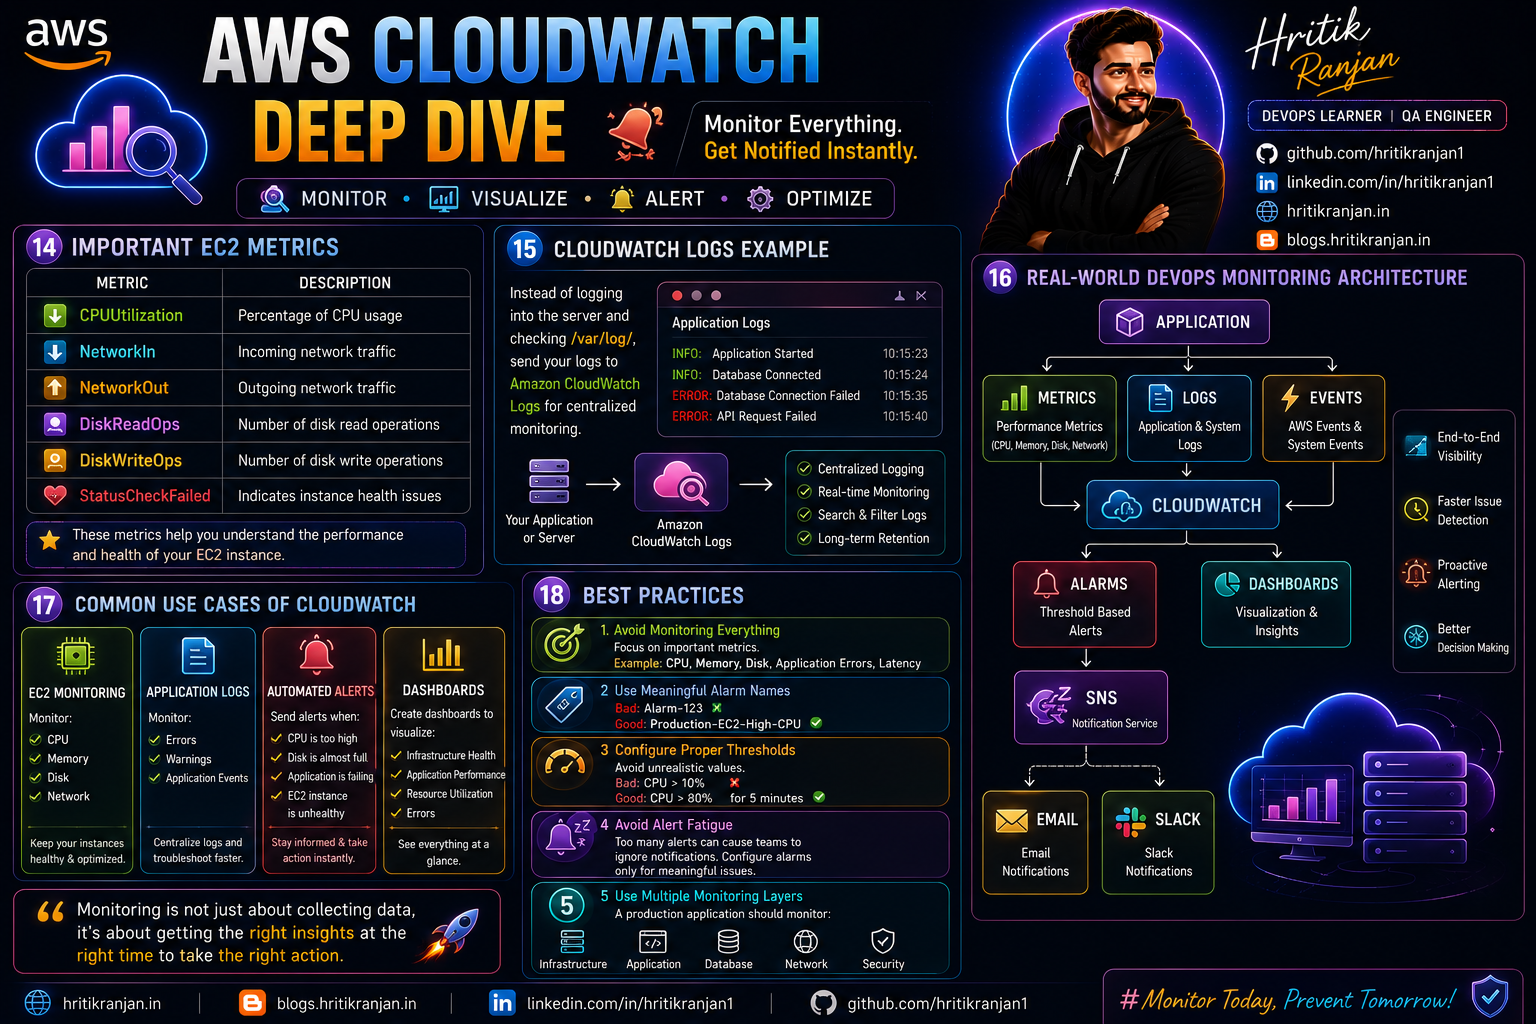
1️⃣4️⃣ Important EC2 Metrics
Here are some useful EC2 metrics:
| Metric | Description |
|---|---|
| CPUUtilization | Percentage of CPU usage |
| NetworkIn | Incoming network traffic |
| NetworkOut | Outgoing network traffic |
| DiskReadOps | Number of disk read operations |
| DiskWriteOps | Number of disk write operations |
| StatusCheckFailed | Indicates instance health issues |
1️⃣5️⃣ CloudWatch Logs Example
Suppose your application generates logs like:
INFO: Application Started

INFO: Database Connected

ERROR: Database Connection Failed

ERROR: API Request Failed
Instead of manually logging into the server and checking:
/var/log/
You can send these logs to:
Amazon CloudWatch Logs
This allows centralized monitoring.
1️⃣6️⃣ Real-World DevOps Monitoring Architecture
In a production environment, monitoring may look like:
                    Application
                         │
          ┌──────────────┼──────────────┐
          │              │              │
          ▼              ▼              ▼
       Metrics          Logs          Events
          │              │              │
          └──────────────┼──────────────┘
                         ▼
                    CloudWatch
                         │
              ┌──────────┴──────────┐
              ▼                     ▼
           Alarms               Dashboards
              │
              ▼
             SNS
              │
        ┌─────┴─────┐
        ▼           ▼
      Email       Slack
1️⃣7️⃣ Common Use Cases of CloudWatch
CloudWatch can be used for:
🖥️ EC2 Monitoring
Monitor:
CPU

Memory

Disk

Network
📜 Application Logs
Monitor:
Errors

Warnings

Application Events
🚨 Automated Alerts
Send alerts when:
CPU is too high

Disk is almost full

Application is failing

EC2 instance is unhealthy
📊 Dashboards
Create dashboards to visualize:
Infrastructure Health

Application Performance

Resource Utilization

Errors
1️⃣8️⃣ Best Practices 💡
1. Avoid Monitoring Everything
Focus on important metrics.
For example:
CPU

Memory

Disk

Application Errors

Latency
2. Use Meaningful Alarm Names
Bad:
Alarm-123
Good:
Production-EC2-High-CPU
3. Configure Proper Thresholds
Avoid setting unrealistic values.
For example:
CPU > 10%
This may generate unnecessary alerts.
Instead:
CPU > 80%
for 5 minutes
4. Avoid Alert Fatigue
Too many alerts can cause teams to ignore notifications.
Configure alarms only for meaningful issues.
5. Use Multiple Monitoring Layers
A production application should monitor:
Infrastructure

Application

Database

Network

Security
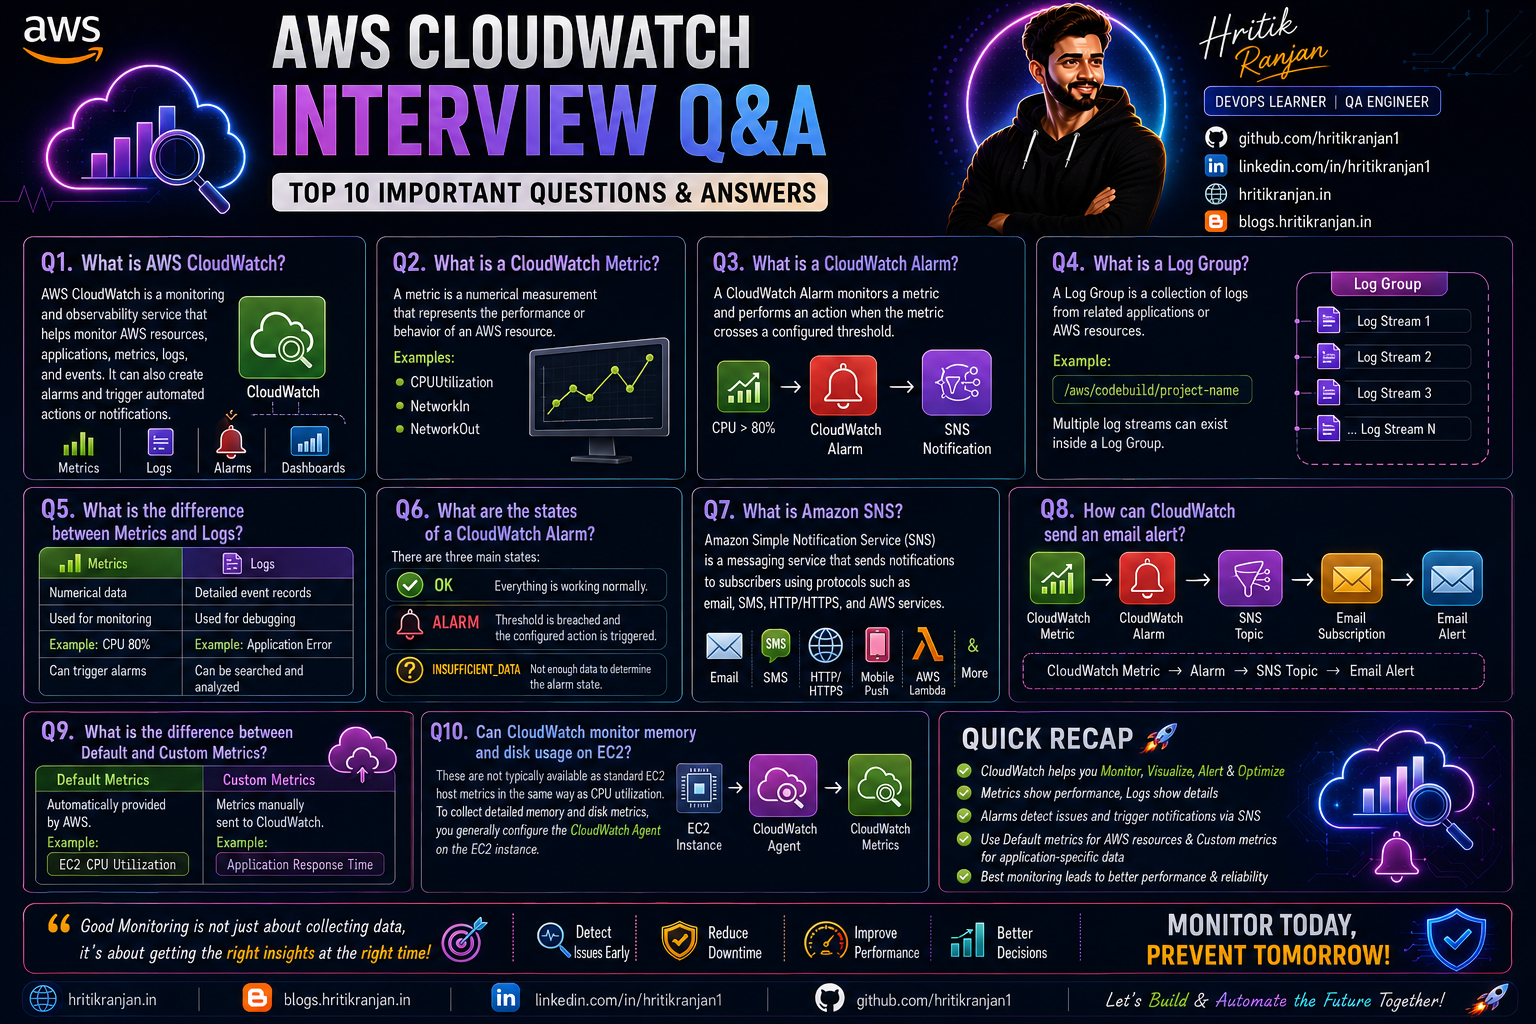
🎯 Important Interview Questions and Answers
Q1. What is AWS CloudWatch?
Answer:
AWS CloudWatch is a monitoring and observability service that helps monitor AWS resources, applications, metrics, logs, and events. It can also create alarms and trigger automated actions or notifications.
Q2. What is a CloudWatch Metric?
Answer:
A metric is a numerical measurement that represents the performance or behavior of an AWS resource.
Examples include:
CPUUtilization

NetworkIn

NetworkOut
Q3. What is a CloudWatch Alarm?
Answer:
A CloudWatch Alarm monitors a metric and performs an action when the metric crosses a configured threshold.
For example:
CPU > 80%
        ↓
CloudWatch Alarm
        ↓
SNS Notification
Q4. What is a Log Group?
Answer:
A Log Group is a collection of logs from related applications or AWS resources.
For example:
/aws/codebuild/project-name
Multiple log streams can exist inside a Log Group.
Q5. What is the difference between Metrics and Logs?
| Metrics | Logs |
|---|---|
| Numerical data | Detailed event records |
| Used for monitoring | Used for debugging |
| Example: CPU 80% | Example: Application Error |
| Can trigger alarms | Can be searched and analyzed |
Q6. What are the states of a CloudWatch Alarm?
There are three main states:
OK

ALARM

INSUFFICIENT_DATA
Q7. What is Amazon SNS?
Answer:
Amazon Simple Notification Service (SNS) is a messaging service that sends notifications to subscribers using protocols such as email, SMS, HTTP/HTTPS, and AWS services.
Q8. How can CloudWatch send an email alert?
The process is:
CloudWatch Metric
        ↓
CloudWatch Alarm
        ↓
SNS Topic
        ↓
Email Subscription
        ↓
Email Alert
Q9. What is the difference between Default and Custom Metrics?
Default Metrics:
Automatically provided by AWS.
Example:
EC2 CPU Utilization
Custom Metrics:
Metrics manually sent to CloudWatch.
Example:
Application Response Time
Q10. Can CloudWatch monitor memory and disk usage on EC2?
Answer:
These are not typically available as standard EC2 host metrics in the same way as CPU utilization. To collect detailed memory and disk metrics, you generally configure the CloudWatch Agent on the EC2 instance.
🏁 Project Summary
In this project, we created a complete monitoring and alerting system.
Architecture:
EC2 Instance
      │
      ▼
CloudWatch Metrics
      │
      ▼
CloudWatch Alarm
      │
      ▼
Amazon SNS
      │
      ▼
📧 Email Notification
What We Learned
✅ What AWS CloudWatch is
✅ Why monitoring is important
✅ CloudWatch Metrics
✅ CloudWatch Logs
✅ Log Groups and Log Streams
✅ CloudWatch Alarms
✅ Amazon SNS
✅ EC2 CPU Monitoring
✅ Creating CPU Threshold Alerts
✅ Sending Email Notifications
✅ Default vs Custom Metrics
✅ CloudWatch Best Practices
✅ Real-world monitoring concepts
🎉 Conclusion
AWS CloudWatch is one of the most important services for monitoring AWS infrastructure.
As a DevOps Engineer, deploying an application is only one part of the job. You also need to know whether the application and infrastructure are healthy.
CloudWatch helps answer questions such as:
Is my server healthy? 🖥️

Is CPU usage too high? 📈

Is my application generating errors? ❌

Is disk space running out? 💾

Should the DevOps team be alerted? 🚨
By combining CloudWatch + CloudWatch Alarms + Amazon SNS, we can build an automated monitoring and alerting system that helps teams detect issues quickly.
Build it → Monitor it → Detect problems → Alert the team → Improve reliability. 🚀
This project is a great beginner step toward understanding AWS Monitoring, Observability, and Production Infrastructure.
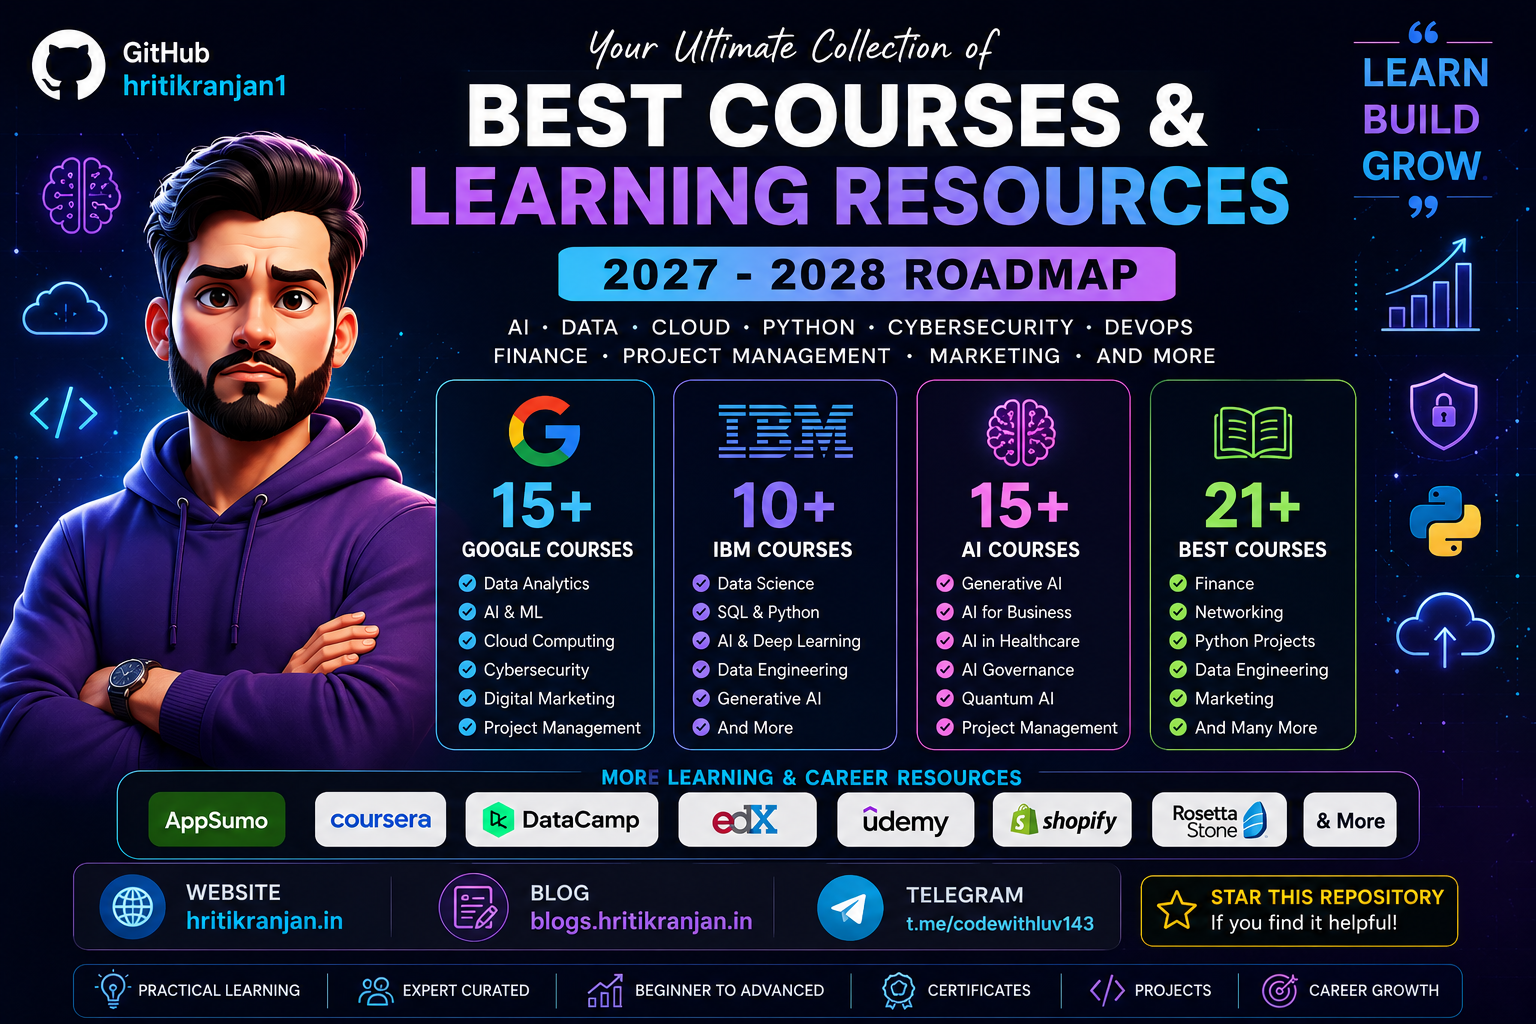
🚀 Complete Learning & Career Resources | 2027–2028
A curated collection of learning resources for AI, Data Analytics, Python, Data Engineering, Cybersecurity, Cloud, Networking, Finance, Digital Marketing, Project Management, DevOps and Generative AI.
📚 Learn → 🧪 Practice → 🛠️ Build → 🐙 Share → 🚀 Grow









🌟 About This Repository
Welcome to the Complete Learning & Career Resources Repository! 🚀
This repository is designed as a centralized learning hub for students, developers, QA engineers, DevOps engineers, cloud learners, cybersecurity enthusiasts, data professionals, project managers, business professionals and anyone interested in continuous learning.
The goal is simple:
Learn → Practice → Build → Document → Share → Grow
Instead of searching for useful resources again and again, this repository brings them together in one place.
🎯 What You Will Find Here
🤖 Artificial Intelligence
🧠 Generative AI
📊 Data Analytics
🐍 Python
⚙️ Data Engineering
☁️ Cloud Computing
🌐 Computer Networking
🔐 Cybersecurity
⚙️ DevOps
📋 Project Management
💰 Finance
📈 Digital Marketing
🧩 Business Analysis
🚀 Career Development
🎓 Professional Learning
🛠️ Project Ideas
📚 Learning Roadmaps
📊 Repository Overview
| Category | Resources |
|---|---|
| 🤖 AI Courses | 15 |
| 🔵 Google Courses | 15 |
| 🟣 IBM Courses | 10 |
| 🔥 Best Courses 2027–2028 | 21 |
| 🌟 Learning & Career Resources | 14 |
| 📖 Personal Resources | 4+ |
📚 Table of Contents
🤖 AI Courses
🚀 Explore AI fundamentals, Python, AI infrastructure, Generative AI, AI governance and specialized AI applications.
| # | Course | Link |
|---|---|---|
| 1 | AI For Everyone | Start Course ↗ |
| 2 | AI Python for Beginners | Start Course ↗ |
| 3 | AI Infrastructure and Operations Fundamentals | Start Course ↗ |
| 4 | Generative AI for Human Resources (HR) Professionals | Start Course ↗ |
| 5 | AI Fundamentals | Start Course ↗ |
| 6 | AI for Healthcare | Start Course ↗ |
| 7 | AI Applications in Accounting and Finance | Start Course ↗ |
| 8 | AI Governance and Privacy Professional Certification (AIGP) | Start Course ↗ |
| 9 | Ethics and Governance in the Age of Generative AI | Start Course ↗ |
| 10 | Hands-on quantum error correction with Google Quantum AI | Start Course ↗ |
| 11 | AI-Powered Higher Education | Start Course ↗ |
| 12 | Modern Project Leadership: Agile, AI, and Beyond | Start Course ↗ |
| 13 | AI-Powered Business Analysis: Excel, KPIs & GenAI | Start Course ↗ |
| 14 | AI in Law: Research, Risk, and Legal Drafting | Start Course ↗ |
| 15 | Generative AI for Project Managers | Start Course ↗ |
🔵 Google Courses
🌐 Explore Data Analytics, AI, Cybersecurity, Networking, Cloud, Digital Marketing and Project Management.
| # | Course | Link |
|---|---|---|
| 1 | Foundations: Data, Data, Everywhere | Start Course ↗ |
| 2 | Ask Questions to Make Data-Driven Decisions | Start Course ↗ |
| 3 | Prepare Data for Exploration | Start Course ↗ |
| 4 | Agile Project Management | Start Course ↗ |
| 5 | Project Initiation: Starting a Successful Project | Start Course ↗ |
| 6 | AI Fundamentals | Start Course ↗ |
| 7 | Foundations of Digital Marketing and E-commerce | Start Course ↗ |
| 8 | Play It Safe: Manage Security Risks | Start Course ↗ |
| 9 | The Bits and Bytes of Computer Networking | Start Course ↗ |
| 10 | Analyze Data to Answer Questions | Start Course ↗ |
| 11 | Automate Cybersecurity Tasks with Python | Start Course ↗ |
| 12 | Architecting with Google Compute Engine | Start Course ↗ |
| 13 | AI for Writing and Communicating | Start Course ↗ |
| 14 | From Likes to Leads: Interact with Customers Online | Start Course ↗ |
| 15 | AI for Data Analysis | Start Course ↗ |
🟣 IBM Courses
💙 Explore SQL, Python, Data Analytics, Deep Learning, RAG and Generative AI resources.
| # | Course | Link |
|---|---|---|
| 1 | Databases and SQL for Data Science with Python | Start Course ↗ |
| 2 | RAG and Agentic AI Capstone Project | Start Course ↗ |
| 3 | Excel Basics for Data Analysis | Start Course ↗ |
| 4 | Introduction to Data Analytics | Start Course ↗ |
| 5 | Data Visualization and Dashboards with Excel and Cognos | Start Course ↗ |
| 6 | IBM AI Foundations for Business | Start Course ↗ |
| 7 | AI Capstone Project with Deep Learning | Start Course ↗ |
| 8 | Python Project for Data Engineering | Start Course ↗ |
| 9 | Building Generative AI-Powered Applications with Python | Start Course ↗ |
| 10 | Vector Databases for RAG: An Introduction | Start Course ↗ |
🔥 Best Courses 2027–2028
🎯 A broader collection covering AI, Data, Python, Finance, Cybersecurity, Marketing, Networking, Management and Data Engineering.
| # | Course | Link |
|---|---|---|
| 1 | AI For Everyone | Start Course ↗ |
| 2 | Foundations: Data, Data, Everywhere | Start Course ↗ |
| 3 | Ask Questions to Make Data-Driven Decisions | Start Course ↗ |
| 4 | Prepare Data for Exploration | Start Course ↗ |
| 5 | Financial Markets | Start Course ↗ |
| 6 | Agile Project Management | Start Course ↗ |
| 7 | Play It Safe: Manage Security Risks | Start Course ↗ |
| 8 | Project Initiation: Starting a Successful Project | Start Course ↗ |
| 9 | AI Fundamentals | Start Course ↗ |
| 10 | Analyze Data to Answer Questions | Start Course ↗ |
| 11 | Foundations of Digital Marketing and E-commerce | Start Course ↗ |
| 12 | The Bits and Bytes of Computer Networking | Start Course ↗ |
| 13 | Sequence Models | Start Course ↗ |
| 14 | Federal Taxation I: Individuals, Employees, and Sole Proprietors | Start Course ↗ |
| 15 | Designing the Organization | Start Course ↗ |
| 16 | Game Theory | Start Course ↗ |
| 17 | Using Python to Access Web Data | Start Course ↗ |
| 18 | Viral Marketing and How to Craft Contagious Content | Start Course ↗ |
| 19 | Python Project for Data Engineering | Start Course ↗ |
| 20 | Value Chain Management | Start Course ↗ |
| 21 | Applying Data Analytics in Finance | Start Course ↗ |
🌟 Learning & Career Resources
💡 Additional resources for learning, career development, language learning, hosting, education and professional growth.
🗺️ Recommended Learning Roadmaps
Choose one roadmap according to your career goal. You don't need to learn everything at once.
🤖 AI Roadmap
AI Fundamentals
      ↓
Python Basics
      ↓
Mathematics & Statistics
      ↓
Data Fundamentals
      ↓
Machine Learning
      ↓
Deep Learning
      ↓
Generative AI
      ↓
Prompt Engineering
      ↓
RAG
      ↓
Vector Databases
      ↓
Agentic AI
      ↓
AI Applications
      ↓
Real-World Projects
      ↓
GitHub Portfolio