
DevOps Week 8 – Advanced Kubernetes Management, Observability & Monitoring ☸️📊
Master Kubernetes Custom Resources (CRDs), Custom Controllers, ConfigMaps, Secrets, Observability, Prometheus, Grafana Monitoring, Metrics Collection, and Production-Ready Kubernetes Operations.
Kubernetes Custom Resources (CR), CRD & Custom Controller ☸️

📌 Why Do We Need Custom Resources in Kubernetes?
Kubernetes already provides built-in resources like:
Pod
Deployment
Service
ConfigMap
Secret
But in real-world production environments, companies need extra functionality such as:
Service Mesh (Istio)
GitOps (ArgoCD)
Monitoring (Prometheus)
Security Tools
Database Operators
Kubernetes cannot manage all these specialized tools by default.
👉 So Kubernetes provides Custom Resources to extend its capabilities.
🌍 What is a Custom Resource (CR)?
A Custom Resource (CR) is a new object type created by users inside Kubernetes.
It works like native Kubernetes objects.
Example:
Instead of creating only Pods or Deployments, we can create:
Database
Backup
Monitoring
VirtualService
Application
as Kubernetes resources.
📖 What is a CRD (Custom Resource Definition)?
A CRD is a YAML configuration that tells Kubernetes:
“Hey Kubernetes, a new resource type exists.”
It defines:
✅ Resource name
✅ API version
✅ Structure/schema
✅ Validation rules
💡 Simple Real-Life Example
Imagine Kubernetes is a smartphone.
Built-in apps = Native Kubernetes resources.
CRD = Installing a new app.
CR = Using that app.
Controller = Background service that makes the app work.
🛠️ Example of CRD
apiVersion: apiextensions.k8s.io/v1
kind: CustomResourceDefinition
metadata:
  name: databases.mycompany.com

spec:
  group: mycompany.com

  names:
    kind: Database
    plural: databases

  scope: Namespaced

  versions:
    - name: v1
      served: true
      storage: true
👉 This CRD creates a new Kubernetes resource called:
Database
📦 What is a Custom Resource (CR)?
After CRD creation, users can create actual objects using that resource type.
Example:
apiVersion: mycompany.com/v1
kind: Database

metadata:
  name: mysql-db

spec:
  engine: mysql
  size: small
This is called a:
✅ Custom Resource (CR)

🎛️ What is a Custom Controller?
A Custom Controller continuously watches Kubernetes resources.
It checks:
“Has a new custom resource been created?”
If yes:
✅ It performs actions automatically.
🔄 How Custom Controller Works?
Example:
User creates:
kind: Database
Controller sees it and automatically:
✅ Creates Pods
✅ Creates Storage
✅ Configures networking
✅ Sets permissions
✅ Monitors database
This automation is the core power of Kubernetes Operators.
⚙️ Complete Workflow Explained
Step 1 — Deploy CRD
DevOps Engineer deploys:
kubectl apply -f crd.yaml
Kubernetes now understands the new resource type.
Step 2 — Deploy Controller
Controller is deployed inside the cluster.
It watches the custom resources.
Step 3 — User Creates CR
User creates:
kind: Database
Step 4 — Controller Takes Action
Controller automatically performs required operations.
🏢 Real-World Tools Using CRDs & Controllers
| Tool | Purpose |
|---|---|
| Istio | Service Mesh |
| ArgoCD | GitOps |
| Prometheus Operator | Monitoring |
| Cert-Manager | SSL Certificates |
| Crossplane | Cloud Infrastructure |
| Elastic Operator | Elasticsearch Management |
🔥 Why Are Custom Controllers Important?
Without controller:
❌ CRD is only a schema/template
❌ No actual automation happens
Controller is the “brain” behind custom resources.
🧠 Beginner-Friendly Analogy
| Component | Real-Life Example |
|---|---|
| CRD | Form Template |
| CR | Filled Form |
| Controller | Employee processing the form |
🛡️ Benefits of CRDs & Controllers
✅ Extend Kubernetes functionality
✅ Full automation
✅ Reduce manual work
✅ Infrastructure as Code
✅ Easy scaling
✅ Production-ready operations
💻 Which Language is Used for Controllers?
Most Kubernetes controllers are written in:
Golang (Go)
Because Kubernetes itself is written in Go.
Popular frameworks:
client-go
controller-runtime
Kubebuilder
📚 Important Interview Questions
❓ What is a CRD in Kubernetes?
✅ Answer:
CRD allows users to create new custom resource types inside Kubernetes.
❓ What is the difference between CRD and CR?
| CRD | CR |
|---|---|
| Defines new resource type | Actual instance/object |
| Works like template | Works like real object |
❓ Why is Controller required?
✅ Answer:
Controller watches resources and performs automation tasks based on desired state.
Without controller, CRD alone does nothing.
❓ What is an Operator in Kubernetes?
✅ Answer:
An Operator is an advanced custom controller that automates application management inside Kubernetes.
🔄 Beginner-Friendly Architecture Flow
DevOps Engineer
        ↓
Deploy CRD
        ↓
Deploy Controller
        ↓
User Creates Custom Resource
        ↓
Controller Watches Resource
        ↓
Automation Happens
        ↓
Pods / Services / Storage Created
📘 Kubernetes ConfigMaps & Secrets Explained ☸️🔐

🔹 Why ConfigMaps & Secrets Are Important? 🤔
In real-world applications, many values change depending on the environment.
Examples:
Database URL
Database Port
API Endpoints
Passwords
API Keys
Tokens
If these values are written directly inside application code:
❌ Application becomes difficult to manage
❌ Security risks increase
❌ Updating configuration requires rebuilding application
🔹 Real-World Example 💡
Suppose your application runs in:
Development
Testing
Production
Each environment uses:
Different database
Different API URLs
Different credentials
Instead of changing code every time, Kubernetes provides:
✅ ConfigMaps
✅ Secrets
to manage configurations separately.
🔹 What is a ConfigMap? ⚙️
ConfigMap is a Kubernetes object used to store:
Non-sensitive configuration data
Examples:
✅ Database host
✅ Application mode
✅ Port numbers
✅ Feature flags
✅ Connection types
🔹 Why Use ConfigMaps? 🚀
ConfigMaps help:
✅ Separate configuration from code
✅ Reuse same application image in multiple environments
✅ Simplify updates
✅ Improve maintainability
🔹 Beginner-Friendly Example 💡
Instead of writing:
DATABASE_PORT = 5432
inside application code, store it in:
Kubernetes ConfigMap
Application reads it dynamically.
🔹 What is a Secret? 🔐
Secrets are Kubernetes objects used to store:
Sensitive information securely
Examples:
✅ Passwords
✅ API keys
✅ Tokens
✅ Certificates
✅ Database credentials
🔹 Why Secrets Are Important? ⚠️
Sensitive data should never be:
❌ Hardcoded in code
❌ Stored publicly
❌ Shared insecurely
Secrets help protect:
Confidential application data
🔹 Difference Between ConfigMap & Secret ⚔️
| ConfigMap | Secret |
|---|---|
| Non-sensitive data | Sensitive data |
| Plain configuration | Passwords/API keys |
| Easier visibility | Base64 encoded |
| Lower security requirements | Higher security requirements |
🔹 How Kubernetes Stores Secrets? 🗂️
Kubernetes stores Secrets inside:
etcd database
By default: Secrets are:
Base64 encoded
🔹 Important Beginner Note ⚠️
Base64 encoding is:
NOT strong encryption
It only hides data in encoded format.
For production environments, additional tools are recommended:
✅ HashiCorp Vault
✅ Sealed Secrets
✅ External Secret Managers
🔹 RBAC & Secrets Security 🔒
Secrets should always be protected using:
RBAC (Role-Based Access Control)
Only authorized users should access:
Passwords
Tokens
Certificates
🔹 Ways to Use ConfigMaps Inside Pods 📦
The instructor demonstrated two major methods:
✅ Environment Variables
✅ Volume Mounts
🔹 ConfigMaps as Environment Variables 🌍
ConfigMap values can be injected directly into containers as:
Environment variables
Applications can read values dynamically.
🔹 Real-Life Example 💡
Instead of changing code, developers can update:
Kubernetes ConfigMap
and application automatically uses new configuration.
🔹 Example ConfigMap YAML 📄
apiVersion: v1
kind: ConfigMap
metadata:
  name: app-config
data:
  DATABASE_HOST: postgres-service
  DATABASE_PORT: "5432"
🔹 Using ConfigMap in Pod as Environment Variable ⚙️
env:
- name: DATABASE_HOST
  valueFrom:
    configMapKeyRef:
      name: app-config
      key: DATABASE_HOST
🔹 Benefits of Environment Variables ✅
✅ Easy to configure
✅ Beginner friendly
✅ Good for small configurations
🔹 Limitation of Environment Variables ⚠️
If ConfigMap changes:
Container restart is usually required
to reflect updated values.
🔹 ConfigMaps as Volume Mounts 📂
Another powerful approach is:
Mounting ConfigMaps as files inside Pods
🔹 Biggest Advantage of Volume Mounts 🚀
If ConfigMap changes:
Files update automatically inside Pod
without restarting container.
🔹 Why This is Important? 💡
This helps:
✅ Avoid downtime
✅ Dynamically update configuration
✅ Improve production stability
🔹 Real-World Example 🌍
Suppose: Application uses:
nginx.conf
Instead of rebuilding container, you update ConfigMap.
Kubernetes automatically updates configuration file inside Pod.
🔹 Example Volume Mount YAML 📄
volumeMounts:
- name: config-volume
  mountPath: /etc/config

volumes:
- name: config-volume
  configMap:
    name: app-config
🔹 Why Volume Mounts Are Preferred in Production? 🚀
Because they provide:
✅ Dynamic updates
✅ No downtime
✅ Better scalability
✅ Easier maintenance
🔹 Managing Kubernetes Secrets 🔐
The instructor demonstrated:
✅ Creating Secret
✅ Storing password securely
✅ Accessing Secret inside Pod
🔹 Example Secret YAML 📄
apiVersion: v1
kind: Secret
metadata:
  name: db-secret
type: Opaque
data:
  password: cGFzc3dvcmQxMjM=
🔹 Why Secret Value Looks Strange? 🤔
Because Kubernetes stores Secret values in:
Base64 encoded format
🔹 Decoding Secret Value 🧪
Example:
echo cGFzc3dvcmQxMjM= | base64 --decode
Output:
password123
🔹 Important Production Recommendation 🚀
For enterprise environments, companies usually use:
✅ HashiCorp Vault
✅ AWS Secrets Manager
✅ Azure Key Vault
✅ Sealed Secrets
for stronger security.
🔹 Real-World Production Use Cases 🏢
ConfigMaps are used for:
✅ Application configuration
✅ Feature toggles
✅ Database endpoints
✅ Environment settings
Secrets are used for:
✅ Passwords
✅ API keys
✅ Certificates
✅ Tokens
🔹 Beginner-Friendly Architecture ☸️
ConfigMap / Secret
          ↓
      Kubernetes Pod
          ↓
 Environment Variable / Volume Mount
          ↓
      Application Uses Config
🔹 Important kubectl Commands ⚙️
✔ View ConfigMaps
kubectl get configmaps
✔ View Secrets
kubectl get secrets
✔ Describe ConfigMap
kubectl describe configmap app-config
✔ Describe Secret
kubectl describe secret db-secret
✔ Create ConfigMap
kubectl create configmap app-config --from-literal=PORT=8080
✔ Create Secret
kubectl create secret generic db-secret --from-literal=password=password123
🔥 Real-World Scenario Based Questions
❓ Why should configurations not be hardcoded?
✅ Answer:
Because configurations change across environments and hardcoding makes applications difficult to maintain and insecure.
❓ Why use ConfigMaps?
✅ Answer:
ConfigMaps separate configuration from application code and allow dynamic configuration management.
❓ Why use Secrets instead of ConfigMaps for passwords?
✅ Answer:
Secrets are designed for sensitive information and provide better security controls.
❓ Why are Volume Mounts preferred in production?
✅ Answer:
Because ConfigMap updates automatically reflect inside Pods without restarting containers.
❓ Is Base64 encoding secure encryption?
✅ Answer:
No. Base64 is only encoding, not strong encryption.
Additional security tools are recommended for production.
🔥 Interview Tip 🚀
If interviewer asks:
Difference between ConfigMap & Secret?
Best answer:
ConfigMaps store non-sensitive configuration data, while Secrets securely store sensitive information like passwords and API keys.

💡 Introduction to Observability
Observability is the ability to understand the internal state of a system by analyzing the data it produces, including logs, metrics, and traces.
Monitoring(Metrics): involves tracking system metrics like CPU usage, memory usage, and network performance. Provides alerts based on predefined thresholds and conditions
Monitoring tells us what is happening.
Logging(Logs): involves the collection of log data from various components of a system.
Logging explains why it is happening.
Tracing(Traces): involves tracking the flow of a request or transaction as it moves through different services and components within a system.
Tracing shows how it is happening.

🤔 Why Monitoring?
Monitoring helps us keep an eye on our systems to ensure they are working properly.
Perpose: maintaining the health, performance, and security of IT environments.
It enables early detection of issues, ensuring that they can be addressed before causing significant downtime or data loss.
We use monitoring to:
Detect Problems Early
Measure Performance:
Ensure Availability:
🤔 Why Observability?
Observability helps us understand why our systems are behaving the way they are.
It’s like having a detailed map and tools to explore and diagnose issues.
We use observability to:
Diagnose Issues:
Understand Behavior:
Improve Systems:

🆚 What is the Exact Difference Between Monitoring and Observability?
- 🔥 Monitoring is the
when and whatof a system error, and observability is thewhy and how
| Category | Monitoring | Observability |
|---|---|---|
| Focus | Checking if everything is working as expected | Understanding why things are happening in the system |
| Data | Collects metrics like CPU usage, memory usage, and error rates | Collects logs, metrics, and traces to provide a full picture |
| Alerts | Sends notifications when something goes wrong | Correlates events and anomalies to identify root causes |
| Example | If a server's CPU usage goes above 90%, monitoring will alert us | If a website is slow, observability helps us trace the user's request through different services to find the bottleneck |
| Insight | Identifies potential issues before they become critical | Helps diagnose issues and understand system behavior |
🔭 Does Observability Cover Monitoring?
Yes!! Monitoring is subset of Observability
Observability is a broader concept that includes monitoring as one of its components.
monitoring focuses on tracking specific metrics and alerting on predefined conditions
observability provides a comprehensive understanding of the system by collecting and analyzing a wider range of data, including logs, metrics, and traces.
🖥️ What Can Be Monitored?
Infrastructure: CPU usage, memory usage, disk I/O, network traffic.
Applications: Response times, error rates, throughput.
Databases: Query performance, connection pool usage, transaction rates.
Network: Latency, packet loss, bandwidth usage.
Security: Unauthorized access attempts, vulnerability scans, firewall logs.
👀 What Can Be Observed?
Logs: Detailed records of events and transactions within the system.
Metrics: Quantitative data points like CPU load, memory consumption, and request counts.
Traces: Data that shows the flow of requests through various services and components.
🆚 Monitoring on Bare-Metal Servers vs. Monitoring Kubernetes
Bare-Metal Servers:
Direct Access: Easier access to hardware metrics and logs.
Fewer Layers: Simpler environment with fewer abstraction layers.
Kubernetes:
Dynamic Environment: Challenges with monitoring ephemeral containers and dynamic scaling.
Distributed Nature: Requires tools that can handle distributed systems and correlate data from multiple sources.
🆚 Observing on Bare-Metal Servers vs. Observing Kubernetes
Bare-Metal Servers:
- Simpler Observability: Easier to collect and correlate logs, metrics, and traces due to fewer components and layers.
Kubernetes:
Complex Observability: Requires sophisticated tools to handle the dynamic and distributed nature of containers and microservices.
Integration: Necessitates the integration of multiple observability tools to get a complete picture of the system.
⚒️ What are the Tools Available?
Monitoring Tools: Prometheus, Grafana, Nagios, Zabbix, PRTG.
Observability Tools: ELK Stack (Elasticsearch, Logstash, Kibana), EFK Stack (Elasticsearch, FluentBit, Kibana) Splunk, Jaeger, Zipkin, New Relic, Dynatrace, Datadog.
📘 Kubernetes Monitoring Using Prometheus & Grafana ☸️📊

🔹 Why Monitoring is Important in Kubernetes? 🤔
Imagine you have deployed an application successfully.
After a few days:
Pods start crashing
CPU usage becomes very high
Memory gets exhausted
Users report application downtime
Without monitoring: ❌ You won't know what went wrong.
Monitoring helps DevOps teams:
✅ Detect issues early
✅ Track cluster health
✅ Analyze performance
✅ Troubleshoot failures
✅ Improve availability
🔹 Real-Life Example 💡
Think of Kubernetes like an airplane.
Even if the airplane is flying smoothly, pilots continuously monitor:
Fuel level
Engine temperature
Speed
Weather conditions
Similarly, DevOps engineers monitor:
CPU usage
Memory usage
Pod health
Network traffic
Application performance
to ensure everything runs smoothly.
🔹 What is Prometheus? 📈
Prometheus is an open-source monitoring and alerting tool designed for cloud-native applications and Kubernetes environments.
Its primary job is:
Collect and store metrics from Kubernetes and applications
Prometheus continuously gathers data such as:
CPU utilization
Memory consumption
Pod status
Node health
Application metrics
🔹 Why Prometheus is Popular? 🚀
Prometheus is widely used because:
✅ Open Source
✅ Kubernetes Native
✅ Easy Integration
✅ Powerful Query Language (PromQL)
✅ Alerting Support
✅ Large Community Support
🔹 What are Metrics? 📊
Metrics are numerical measurements that tell us how systems are performing.
Examples:
| Metric | Example |
|---|---|
| CPU Usage | 75% |
| Memory Usage | 3 GB |
| Running Pods | 15 |
| Request Count | 10,000 |
| Network Traffic | 500 Mbps |
Metrics help us understand system health.
🔹 How Prometheus Works? ⚙️
Prometheus follows a pull-based model.
Instead of applications sending data, Prometheus periodically collects data from targets.
Workflow:
Kubernetes Cluster
        ↓
 Prometheus Server
        ↓
 Stores Metrics
        ↓
 Grafana Dashboard
🔹 Prometheus Architecture Explained 🏗️
🚀 Prometheus
Prometheus is an open-source systems monitoring and alerting toolkit originally built at SoundCloud.
It is known for its robust data model, powerful query language (PromQL), and the ability to generate alerts based on the collected time-series data.
It can be configured and set up on both bare-metal servers and container environments like Kubernetes.
🏠 Prometheus Architecture
The architecture of Prometheus is designed to be highly flexible, scalable, and modular.
It consists of several core components, each responsible for a specific aspect of the monitoring process.

🔥 Prometheus Server
Prometheus server is the core of the monitoring system. It is responsible for scraping metrics from various configured targets, storing them in its time-series database (TSDB), and serving queries through its HTTP API.
Components:
Retrieval: This module handles the scraping of metrics from endpoints, which are discovered either through static configurations or dynamic service discovery methods.
TSDB (Time Series Database): The data scraped from targets is stored in the TSDB, which is designed to handle high volumes of time-series data efficiently.
HTTP Server: This provides an API for querying data using PromQL, retrieving metadata, and interacting with other components of the Prometheus ecosystem.
Storage: The scraped data is stored on local disk (HDD/SSD) in a format optimized for time-series data.
🌐 Service Discovery
Service discovery automatically identifies and manages the list of scrape targets (i.e., services or applications) that Prometheus monitors.
This is crucial in dynamic environments like Kubernetes where services are constantly being created and destroyed.
Components:
Kubernetes: In Kubernetes environments, Prometheus can automatically discover services, pods, and nodes using Kubernetes API, ensuring it monitors the most up-to-date list of targets.
File SD (Service Discovery): Prometheus can also read static target configurations from files, allowing for flexibility in environments where dynamic service discovery is not used.
📤 Pushgateway
The Pushgateway is used to expose metrics from short-lived jobs or applications that cannot be scraped directly by Prometheus.
These jobs push their metrics to the Pushgateway, which then makes them available for Prometheus to scrape(pull).
Use Case:
- It's particularly useful for batch jobs or tasks that have a limited lifespan and would otherwise not have their metrics collected.
🚨 Alertmanager
The Alertmanager is responsible for managing alerts generated by the Prometheus server.
It takes care of deduplicating, grouping, and routing alerts to the appropriate notification channels such as PagerDuty, email, or Slack.
🧲 Exporters
Exporters are small applications that collect metrics from various third-party systems and expose them in a format Prometheus can scrape. They are essential for monitoring systems that do not natively support Prometheus.
Types of Exporters:
- Common exporters include the Node Exporter (for hardware metrics), the MySQL Exporter (for database metrics), and various other application-specific exporters.
🖥️ Prometheus Web UI
- The Prometheus Web UI allows users to explore the collected metrics data, run ad-hoc PromQL queries, and visualize the results directly within Prometheus.
📊 Grafana
- Grafana is a powerful dashboard and visualization tool that integrates with Prometheus to provide rich, customizable visualizations of the metrics data.
🔌 API Clients
- API clients interact with Prometheus through its HTTP API to fetch data, query metrics, and integrate Prometheus with other systems or custom applications.
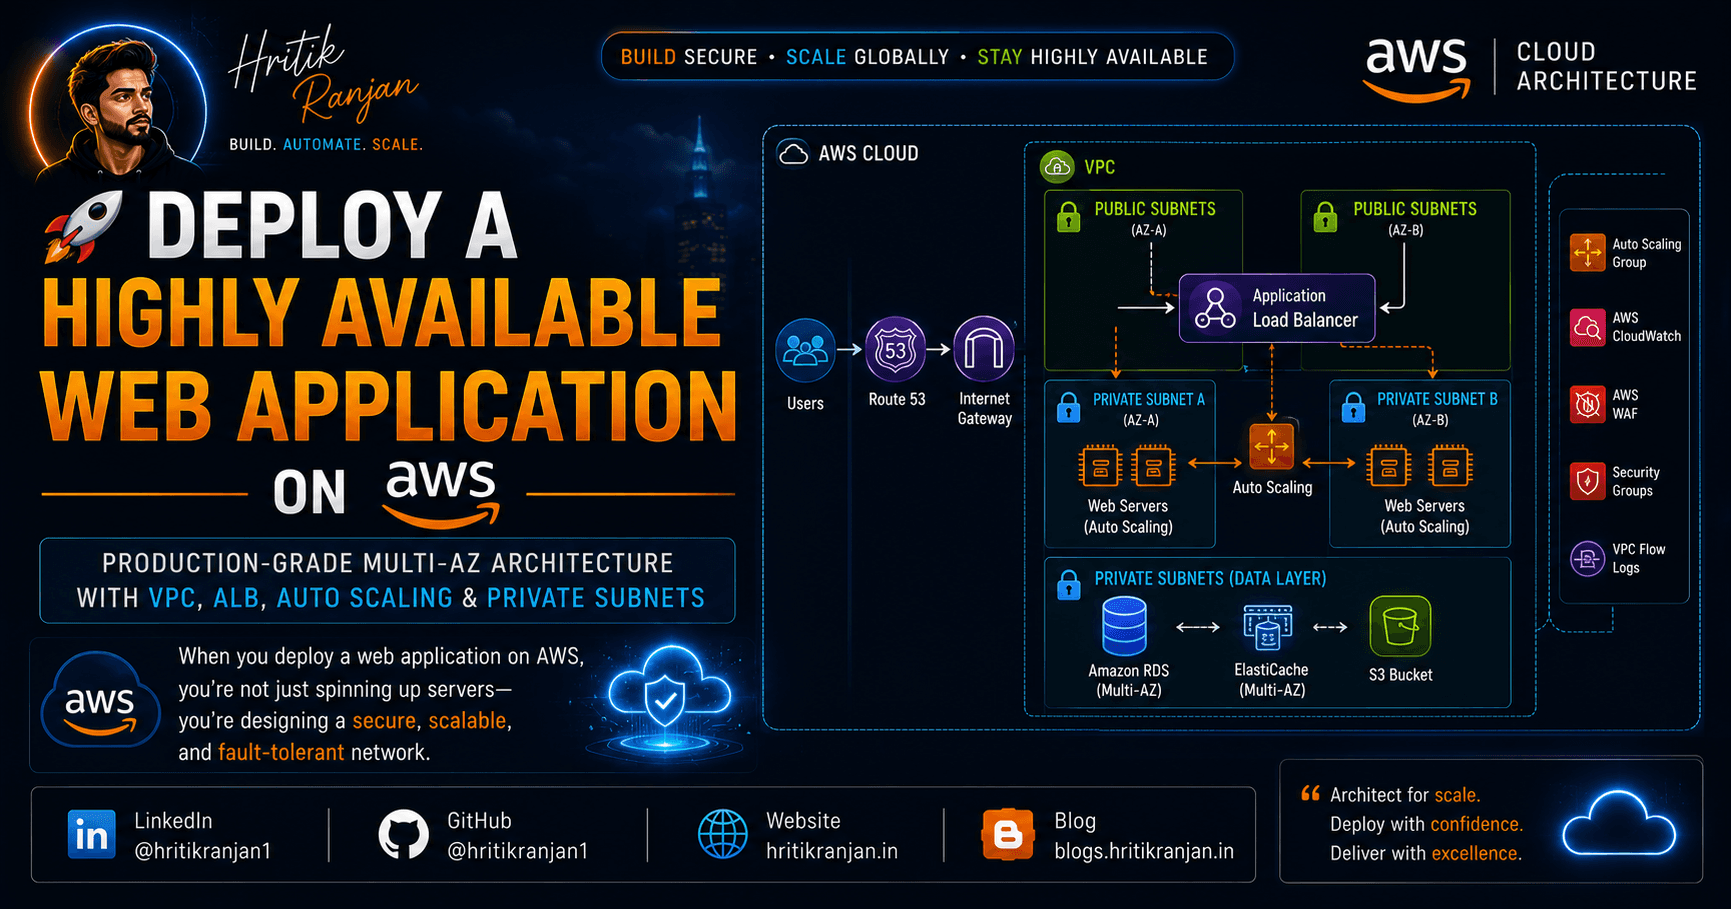
🔹 Kubernetes Monitoring Architecture ☸️
Monitoring workflow:
Kubernetes Cluster
        ↓
 API Server
        ↓
 Prometheus
        ↓
 Time Series Database
        ↓
 AlertManager
        ↓
 Grafana Dashboard
🔹 Setting Up Kubernetes Monitoring 🚀
The instructor used:
Minikube Cluster
Minikube provides a local Kubernetes environment for learning.
Recommended configuration:
minikube start --memory=4096
This allocates 4 GB RAM.
🔹 Why Use Helm? ⚓
Installing monitoring tools manually is difficult.
Helm simplifies deployment.
Helm is often called:
Package Manager for Kubernetes
Similar to:
apt for Ubuntu
yum for CentOS
npm for Node.js
🔹 Installing Prometheus Using Helm 📈
The video demonstrates installing Prometheus using Helm Charts.
Benefits:
✅ Faster installation
✅ Easy upgrades
✅ Consistent deployment
✅ Production-ready setup
🔹 What is Grafana? 📊
Grafana is a visualization tool used to display monitoring data.
Prometheus collects metrics.
Grafana displays them beautifully.
🔹 Why Grafana is Important? 🎨
Raw metrics are difficult to understand.
Grafana converts them into:
✅ Charts
✅ Graphs
✅ Dashboards
✅ Visual Reports
This makes monitoring easier.
🔹 Real-Life Example 💡
Imagine Prometheus as:
Data Collector
and Grafana as:
Data Visualization Expert
Prometheus gathers information.
Grafana presents it in an easy-to-understand format.
🔹 Connecting Grafana with Prometheus 🔗
After Grafana installation:
Prometheus is configured as:
Data Source
Grafana then retrieves metrics from Prometheus.
🔹 Community Dashboards in Grafana 🌍
The instructor imported Dashboard:
ID 3662
This is a popular Kubernetes monitoring dashboard.
Benefits:
✅ Ready-made dashboard
✅ No manual configuration
✅ Cluster overview instantly available
🔹 Metrics Visible in Grafana 📊
The dashboard displays:
CPU utilization
Memory usage
Pod status
Node status
Network traffic
Cluster health
all in one place.
🔹 What is Kube State Metrics? 📦
Kube State Metrics is a special Kubernetes service that provides detailed cluster information.
It exposes metrics about:
✅ Pods
✅ Deployments
✅ ReplicaSets
✅ Services
✅ Nodes
🔹 Why Kube State Metrics is Needed? 🤔
Prometheus can collect basic metrics.
However, for Kubernetes-specific information:
Kube State Metrics is required
It provides deeper visibility into cluster resources.
🔹 Examples of Kube State Metrics 📈
You can monitor:
Number of replicas
Pod restart count
Deployment status
Node readiness
Resource requests
This is extremely useful in production.
🔹 Monitoring Application Health 🩺
Cluster monitoring is important.
Application monitoring is equally important.
Developers expose:
/metrics endpoint
Prometheus then collects application-specific metrics.
🔹 Custom Application Monitoring 🚀
Example metrics:
API response time
Login requests
Database connections
Error rates
Transaction counts
This provides deep visibility into application performance.
🔹 How Prometheus Collects Custom Metrics? ⚙️
Workflow:
Application
      ↓
Metrics Endpoint
      ↓
Prometheus Scraping
      ↓
Grafana Dashboard
🔹 What is Scraping? 🔍
Scraping means:
Prometheus periodically collecting metrics
from applications or Kubernetes resources.
Example:
Every 15 seconds:
Read metrics
Store metrics
Update dashboards
🔹 Benefits of Kubernetes Monitoring 🚀
Monitoring provides:
✅ Faster troubleshooting
✅ Improved reliability
✅ Better performance optimization
✅ Reduced downtime
✅ Capacity planning
🔹 Real Production Use Cases 🏢
Organizations use Prometheus & Grafana for:
Infrastructure Monitoring
Monitor:
Nodes
CPU
Memory
Disk
Application Monitoring
Monitor:
Response times
Errors
Requests
Capacity Planning
Monitor growth trends to determine when infrastructure upgrades are needed.
Incident Detection
Alerts automatically notify teams when problems occur.
🔹 Important kubectl Commands ⚙️
View Pods:
kubectl get pods
View Services:
kubectl get svc
View Deployments:
kubectl get deployments
View Namespaces:
kubectl get namespaces
🔥 Real-World Scenario Based Questions
❓ Why is monitoring important in Kubernetes?
✅ Answer:
Monitoring helps identify failures, performance issues, and resource bottlenecks before they impact users.
❓ What is Prometheus?
✅ Answer:
Prometheus is an open-source monitoring and alerting tool that collects and stores metrics from Kubernetes and applications.
❓ What is Grafana?
✅ Answer:
Grafana is a visualization platform used to create dashboards and graphs from Prometheus metrics.
❓ What is Kube State Metrics?
✅ Answer:
Kube State Metrics exposes detailed Kubernetes object metrics such as Pods, Deployments, Services, and ReplicaSets.
❓ Why use Helm for Prometheus installation?
✅ Answer:
Helm simplifies installation, upgrades, and management of Kubernetes applications using prebuilt charts.
❓ What is AlertManager?
✅ Answer:
AlertManager sends notifications when Prometheus detects issues like high CPU usage, application failures, or node outages.
🔥 Interview Tip 🚀
If an interviewer asks:
"How would you monitor a Kubernetes cluster?"
A strong answer is:
"I would use Prometheus to collect metrics, Grafana to visualize dashboards, Kube State Metrics for Kubernetes-specific insights, and AlertManager for automated notifications and incident response."
🚀 Continue Your Learning Journey
Thank you for taking the time to read this article.
Technology is evolving rapidly, and continuous learning is one of the most valuable investments you can make in your career. Whether you're exploring DevOps, Cloud Computing, Artificial Intelligence, Cybersecurity, Software Development, Data Science, or Career Growth, the resources below can help you deepen your knowledge and stay ahead in the industry.
🎓 Recommended Learning Platforms
🚀 Coursera
Learn from world-renowned universities and industry leaders including Google, IBM, Stanford, Microsoft, Meta, and many more.
✔ Professional Certificates ✔ Career-focused Learning Paths ✔ AI & Machine Learning Programs ✔ Cloud & DevOps Certifications ✔ Business & Leadership Courses
🔗 https://imp.i384100.net/k0KvbV
💻 Udemy
One of the largest online learning platforms with practical, hands-on courses covering:
✔ DevOps & Kubernetes ✔ Docker & Cloud Computing ✔ AWS, Azure & GCP ✔ Programming & Development ✔ Cybersecurity & Ethical Hacking
🔗 https://trk.udemy.com/MAL2MY
📊 DataCamp
A great platform for anyone interested in:
✔ Python Programming ✔ SQL & Databases ✔ Data Analytics ✔ Machine Learning ✔ Artificial Intelligence
Interactive learning paths and hands-on projects make it ideal for beginners and professionals alike.
🔗 https://datacamp.pxf.io/nX4kER
🎓 edX
Access high-quality courses and certifications from leading institutions such as:
✔ Harvard University ✔ MIT ✔ Berkeley ✔ Microsoft
Perfect for learners seeking university-level education online.
🎨 Domestika
Enhance your creative skills with courses on:
✔ Graphic Design ✔ Video Editing ✔ Animation ✔ Digital Marketing ✔ Content Creation
🔗 https://domestika.sjv.io/dynKAW
🛠️ Recommended Tools & Resources
🔥 AppSumo
Discover exclusive lifetime deals on:
✔ AI Tools ✔ Productivity Software ✔ Developer Utilities ✔ Marketing Platforms ✔ Business Applications
A must-have resource for developers, creators, freelancers, and entrepreneurs looking to save money while accessing premium tools.
🔗 https://appsumo.8odi.net/L04a33
🛒 Shopify
Looking to start an online business or launch an eCommerce store?
Shopify provides everything you need to build, manage, and scale an online business.
✔ Online Store Builder ✔ Payment Integration ✔ Inventory Management ✔ Marketing Tools
🔗 https://shopify.pxf.io/Vxv09k
🌐 WordPress, WooCommerce & Jetpack
Create professional websites, blogs, and online stores with one of the most trusted web ecosystems in the world.
Ideal for:
✔ Personal Blogs ✔ Portfolio Websites ✔ Business Websites ✔ eCommerce Stores
🔗 https://automattic.pxf.io/Z6vR5W
🌍 Language Learning Resources
🗣️ Preply
Learn English and other languages through personalized one-on-one tutoring sessions with experts from around the world.
🔗 https://preply.sjv.io/o4gBDY
📚 British Council English Online
Improve your professional communication skills and English fluency through structured learning programs.
🔗 https://englishonline.sjv.io/9VOGa4
🧠 Rosetta Stone
One of the most recognized language-learning platforms for immersive language acquisition.
🔗 https://aff.rosettastone.com/X4OyqG
🧪 Science & Educational Resources
🔬 MEL Science
Interactive science kits and educational experiences designed to make STEM learning engaging and practical.
🔗 https://imp.i328067.net/bk2beg
📖 Carson Dellosa Education
Educational materials and learning resources for students, teachers, and lifelong learners.
🔗 https://carsondellosaeducation.sjv.io/E0JbjW
❤️ Support My Work
Creating detailed technical content, tutorials, guides, and learning resources takes significant time and effort.
If you find my articles helpful and would like to support my work, you can do so through the following platforms:
⭐ Become a GitHub Sponsor
Support my open-source contributions, technical content, and community projects.
🔗 https://github.com/sponsors/hritikranjan1
☕ Buy Me a Chai
Enjoying my content? Consider buying me a chai and supporting future tutorials, guides, and educational resources.
🔗 https://www.chai4.me/hritikranjan
👨💻 Connect With Me
Hritik Ranjan
💡 AI Enthusiast ☁️ DevOps Learner 🔐 Cybersecurity Advocate 💻 Software Developer
Connect & Follow
🔗 GitHub: https://github.com/hritikranjan1
🔗 LinkedIn: https://linkedin.com/in/hritikranjan1
📢 Found This Article Helpful?
If this article added value to your learning journey:
✅ Share it with your network
✅ Bookmark it for future reference
✅ Follow for more DevOps, AI, Cloud, Cybersecurity, and Software Engineering content
Thank you for reading and being part of this learning journey.
Keep Learning. Keep Building. Keep Growing. 🚀